


Overview
Product
Duhqa is a B2B on-demand logistics platform that connects small retailers with manufacturers and suppliers operating in Nairobi, Kenya. It consists of a customer ordering mobile app, rider mobile app, and warehouse admin web app. The platform is designed to coordinate ordering, fulfillment, and last-mile delivery.
Role
Solo UX/UI designer working with the development team.
Duration
The project took 11 months.
Challenge
Problem
Nairobi is the biggest economic center in East Africa, growing rapidly but facing issues with road infrastructure. At the time of the project, many parts of the city had roads in poor condition or no roads at all. Local grocery shopping was usually done in small local shops that had major challenges in getting supplies. Duhqa wanted to solve this by having its own warehouse in the city and providing a delivery service through an on-demand delivery platform similar to Wolt, but for B2B customers focusing on small retailers. They used an off-the-shelf Warehouse Management System (WMS) that did not fully work for their needs, and they did not yet have a solution for a customer ordering app.

Constrains
With underdeveloped road infrastructure came challenges such as not having a detailed map of the city, unnamed streets, and missing address data. Main issue we had as Europeans is lack of local context. Another constrain was that this was a small startup with limited budget so we decided early on to use an off-the-shelf design system in order to cut development and design time.
How to make a delivery app for a city with inadequate maps?
How to design for a market without knowing local context?
How to deal with a large scope with limited budget?
Approach
Research
To understand the local context, my project manager and I spent seven days conducting field research in Nairobi. We shadowed warehouse administrators and workers, joined delivery drivers on their routes, interviewed customers, and conducted a competitive analysis. Our biggest question was how drivers were successfully making deliveries despite incomplete maps and missing addresses. Observing the process firsthand revealed the workarounds they relied on and helped us understand the real constraints. With a limited budget, the research also allowed us to prioritize the problems with the greatest impact.

Key insights
Field research showed that many assumptions we had did not hold in real conditions. There were many specific local contexts and needs to be covered:
Shop owners used delivery moments for upselling, sometimes buying items directly from the delivery vehicle that were not originally ordered.
Upsell requests often came from non-users, making it difficult for drivers to keep track of the sails. This made impossible to track most of the upsales in the warehouse dashboard.
Customers typically ordered the same products on a regular basis.
Failed delivery rate was high, around 30%. We noticed that drivers who frequently called and texted customers to confirm delivery locations and time had significantly lower failed deliveries. Although company tried to incentivize all drivers to do this, it was impossible to keep track of driver-customer communication.
Drivers solved unknown addresses and rode conditions by communicating with customers prior to the delivery attempt. Customers usually described their locations by giving turn directions from known toponyms.

Design Decision
Since 95% of the population in Kenya uses Android phones, we decided to build native Android apps for riders and customers, while the admin dashboard was developed as a web application.
We also designed the product around the local context we uncovered during field research. Where possible, we aligned familiar interactions with services like Uber, Wolt, and DoorDash, while adapting or creating new solutions to address challenges unique to the Kenyan market. In order to speed up the design and development process it was decided to use Material Design System.
Solution
Customer app
The customer app included the core functionality expected from any ordering platform: users could search for products, browse categories, add items to the shopping cart, and place orders. Based on our research, we introduced two features tailored to local needs.
Descriptive delivery locations:
Besides entering an address and GPS location, users could add a written description of how to find their destination. This simple addition reduced the need to repeatedly explain directions to driver on calls.
Quick reordering:
We found that customers regularly reordered the same products, often with small changes. To support this, we allowed them to copy item lists from any previous order directly into the shopping cart, where they could adjust quantities or add and remove products. They could also mark past orders as favorites, making frequently purchased lists easier to access and reducing repetitive work.
Rider app
Upselling & instant orders:
We introduced a system where drivers carried additional high-demand products for upselling and could add them directly to an existing customer order during delivery. If a non-user wanted to purchase items from the upsell selection, drivers could quickly create a customer profile and place a new order on the spot. This increased revenue opportunities and expanded the user base while everything was tracked by the admin dashboard.
Delivery communication & rescheduling:
Another key focus was standardizing rider–customer communication. Since clear communication was essential for successful deliveries, riders were required to contact the customer at least once via SMS or call before marking an order as failed. The app tracked whether contact had been made and supported structured follow-up actions, including rescheduling deliveries for the next day based on agreement with the customer. To reduce cognitive load, these “post-call” and rescheduling workflows were designed as guided steps within the app, ensuring riders could complete them consistently and efficiently.
Admin Dashboard
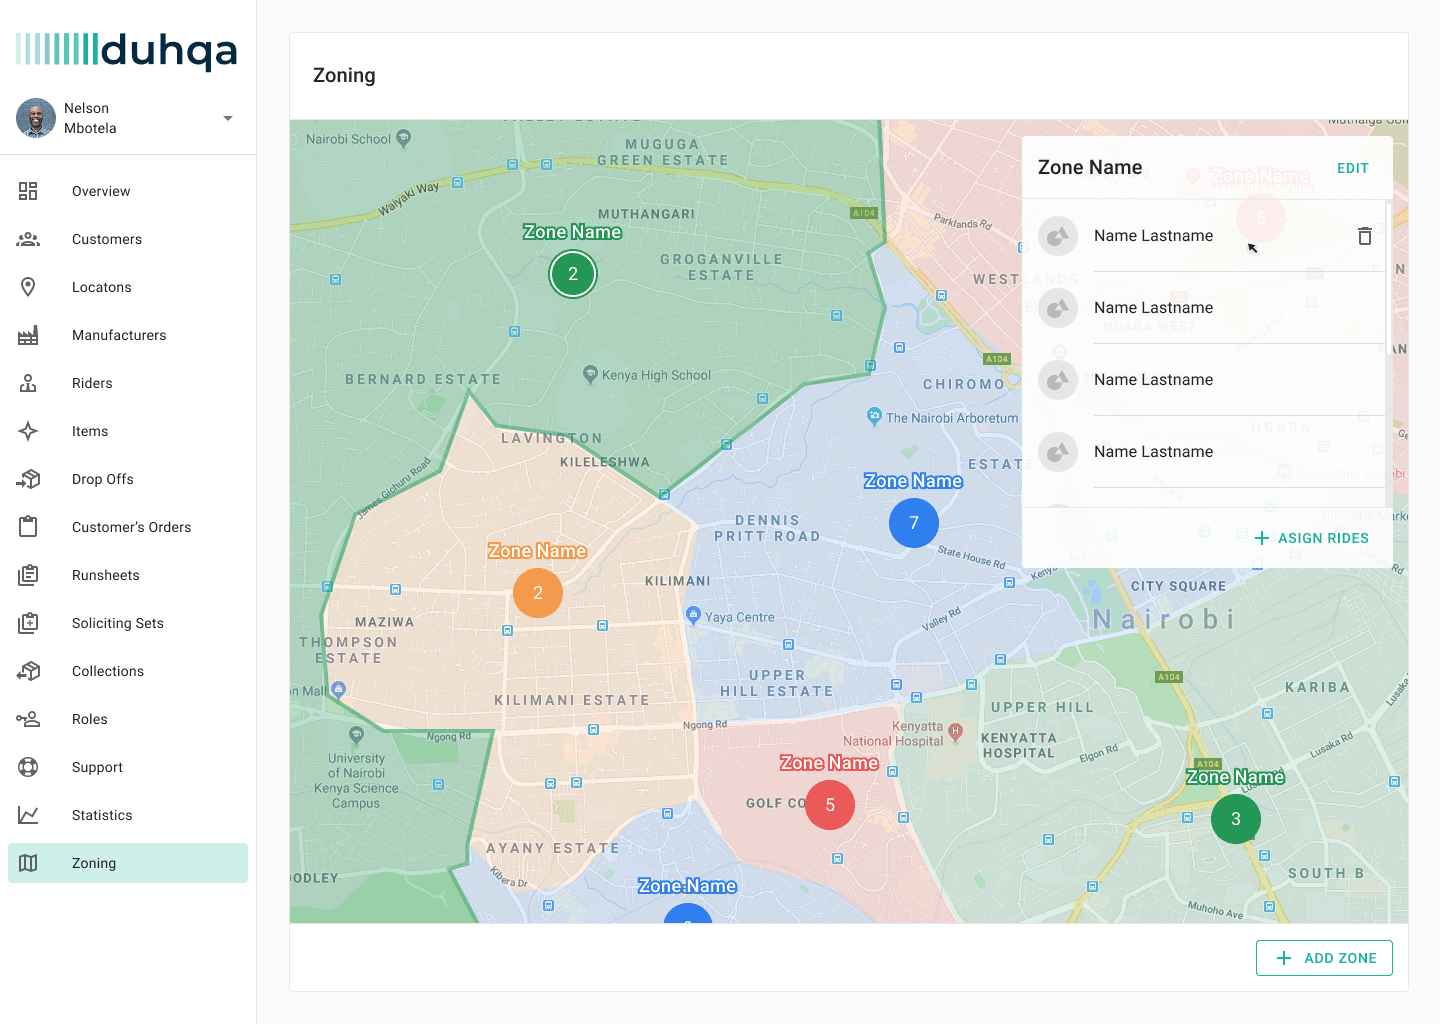
The admin dashboard is the most complex part of the platform, serving as the operational hub for the entire business. It includes management of customers, riders, manufacturers, retail shops, inventory, sales, and user roles.
Administrators have a live operational overview with real-time order tracking, customer complaints, revenue, delivery success rates, and other key business metrics. The dashboard also provides tools to coordinate day-to-day operations and quickly respond to issues across the delivery network.
In addition, a dedicated analytics section allows administrators to explore historical data and identify trends. These insights support better operational decisions, such as optimizing inventory, improving delivery performance, and understanding customer purchasing behavior.




Marketing Website
I designed and developed a marketing website primarily targeting retail customers to support marketing campaigns and attract new users. The website was built in Webflow, allowing the administration team to easily manage and update its content without developer involvement.

Impact
Results
" width="20px"><path d="M 2 18 C 1.45 18 0.979 17.804 0.587 17.413 C 0.196 17.021 0 16.55 0 16 L 0 2 C 0 1.45 0.196 0.979 0.587 0.587 C 0.979 0.196 1.45 0 2 0 L 18 0 C 18.55 0 19.021 0.196 19.413 0.587 C 19.804 0.979 20 1.45 20 2 L 20 16 C 20 16.55 19.804 17.021 19.413 17.413 C 19.021 17.804 18.55 18 18 18 Z M 2 16 L 18 16 L 18 2 L 2 2 Z M 7 14 C 7.283 14 7.521 13.904 7.713 13.712 C 7.904 13.521 8 13.283 8 13 C 8 12.717 7.904 12.479 7.713 12.287 C 7.521 12.096 7.283 12 7 12 L 4 12 C 3.717 12 3.479 12.096 3.287 12.287 C 3.096 12.479 3 12.717 3 13 C 3 13.283 3.096 13.521 3.287 13.712 C 3.479 13.904 3.717 14 4 14 Z M 12.55 9.175 L 11.825 8.45 C 11.625 8.25 11.392 8.154 11.125 8.163 C 10.858 8.171 10.625 8.275 10.425 8.475 C 10.242 8.675 10.146 8.908 10.138 9.175 C 10.129 9.442 10.225 9.675 10.425 9.875 L 11.85 11.3 C 12.05 11.5 12.283 11.6 12.55 11.6 C 12.817 11.6 13.05 11.5 13.25 11.3 L 16.8 7.75 C 17 7.55 17.1 7.317 17.1 7.05 C 17.1 6.783 17 6.55 16.8 6.35 C 16.6 6.15 16.363 6.05 16.088 6.05 C 15.813 6.05 15.575 6.15 15.375 6.35 Z M 7 10 C 7.283 10 7.521 9.904 7.713 9.713 C 7.904 9.521 8 9.283 8 9 C 8 8.717 7.904 8.479 7.713 8.287 C 7.521 8.096 7.283 8 7 8 L 4 8 C 3.717 8 3.479 8.096 3.287 8.287 C 3.096 8.479 3 8.717 3 9 C 3 9.283 3.096 9.521 3.287 9.713 C 3.479 9.904 3.717 10 4 10 Z M 7 6 C 7.283 6 7.521 5.904 7.713 5.713 C 7.904 5.521 8 5.283 8 5 C 8 4.717 7.904 4.479 7.713 4.287 C 7.521 4.096 7.283 4 7 4 L 4 4 C 3.717 4 3.479 4.096 3.287 4.287 C 3.096 4.479 3 4.717 3 5 C 3 5.283 3.096 5.521 3.287 5.713 C 3.479 5.904 3.717 6 4 6 Z" fill="rgb(28, 27, 31)" height="18px" id="LCiy8HJXX" width="20px"/></g></svg>)
Designed a complete B2B logistics platform, including customer, rider, and admin applications.
" width="19px"><path d="M 4.425 6.55 L 8.15 0.475 C 8.25 0.308 8.375 0.188 8.525 0.112 C 8.675 0.038 8.833 0 9 0 C 9.167 0 9.325 0.038 9.475 0.112 C 9.625 0.188 9.75 0.308 9.85 0.475 L 13.575 6.55 C 13.675 6.717 13.725 6.892 13.725 7.075 C 13.725 7.258 13.683 7.425 13.6 7.575 C 13.517 7.725 13.4 7.846 13.25 7.938 C 13.1 8.029 12.925 8.075 12.725 8.075 L 5.275 8.075 C 5.075 8.075 4.9 8.029 4.75 7.938 C 4.6 7.846 4.483 7.725 4.4 7.575 C 4.317 7.425 4.275 7.258 4.275 7.075 C 4.275 6.892 4.325 6.717 4.425 6.55 Z M 14.5 19.075 C 13.25 19.075 12.188 18.638 11.313 17.763 C 10.438 16.888 10 15.825 10 14.575 C 10 13.325 10.438 12.263 11.313 11.388 C 12.188 10.513 13.25 10.075 14.5 10.075 C 15.75 10.075 16.813 10.513 17.688 11.388 C 18.563 12.263 19 13.325 19 14.575 C 19 15.825 18.563 16.888 17.688 17.763 C 16.813 18.638 15.75 19.075 14.5 19.075 Z M 0 17.575 L 0 11.575 C 0 11.292 0.096 11.054 0.288 10.863 C 0.479 10.671 0.717 10.575 1 10.575 L 7 10.575 C 7.283 10.575 7.521 10.671 7.713 10.863 C 7.904 11.054 8 11.292 8 11.575 L 8 17.575 C 8 17.858 7.904 18.096 7.713 18.288 C 7.521 18.479 7.283 18.575 7 18.575 L 1 18.575 C 0.717 18.575 0.479 18.479 0.288 18.288 C 0.096 18.096 0 17.858 0 17.575 Z M 14.5 17.075 C 15.2 17.075 15.792 16.833 16.275 16.35 C 16.758 15.867 17 15.275 17 14.575 C 17 13.875 16.758 13.283 16.275 12.8 C 15.792 12.317 15.2 12.075 14.5 12.075 C 13.8 12.075 13.208 12.317 12.725 12.8 C 12.242 13.283 12 13.875 12 14.575 C 12 15.275 12.242 15.867 12.725 16.35 C 13.208 16.833 13.8 17.075 14.5 17.075 Z M 2 16.575 L 6 16.575 L 6 12.575 L 2 12.575 Z M 7.05 6.075 L 10.95 6.075 L 9 2.925 Z" fill="rgb(28, 27, 31)" height="19.07501983642578px" id="ZdpoN1Cwq" width="19px"/></g></svg>)
Adapted common delivery app patterns to the unique operational challenges of Nairobi.
Reduced repetitive customer actions through quick reordering and favorite order lists.
Enabled riders to generate additional revenue through tracked upselling and on-the-spot customer registration.
Standardized rider–customer communication and delivery rescheduling workflows.
Provided administrators real-time operational visibility and historical analytics to support data-driven decision making.
Lessons learned
" width="18px"><path d="M 7.6 12.25 L 5.45 10.1 C 5.267 9.917 5.033 9.825 4.75 9.825 C 4.467 9.825 4.233 9.917 4.05 10.1 C 3.867 10.283 3.775 10.517 3.775 10.8 C 3.775 11.083 3.867 11.317 4.05 11.5 L 6.9 14.35 C 7.1 14.55 7.333 14.65 7.6 14.65 C 7.867 14.65 8.1 14.55 8.3 14.35 L 13.95 8.7 C 14.133 8.517 14.225 8.283 14.225 8 C 14.225 7.717 14.133 7.483 13.95 7.3 C 13.767 7.117 13.533 7.025 13.25 7.025 C 12.967 7.025 12.733 7.117 12.55 7.3 Z M 2 20 C 1.45 20 0.979 19.804 0.587 19.413 C 0.196 19.021 0 18.55 0 18 L 0 4 C 0 3.45 0.196 2.979 0.587 2.587 C 0.979 2.196 1.45 2 2 2 L 6.2 2 C 6.417 1.4 6.779 0.917 7.287 0.55 C 7.796 0.183 8.367 0 9 0 C 9.633 0 10.204 0.183 10.713 0.55 C 11.221 0.917 11.583 1.4 11.8 2 L 16 2 C 16.55 2 17.021 2.196 17.413 2.587 C 17.804 2.979 18 3.45 18 4 L 18 18 C 18 18.55 17.804 19.021 17.413 19.413 C 17.021 19.804 16.55 20 16 20 Z M 2 18 L 16 18 L 16 4 L 2 4 Z M 9.537 3.037 C 9.679 2.896 9.75 2.717 9.75 2.5 C 9.75 2.283 9.679 2.104 9.537 1.962 C 9.396 1.821 9.217 1.75 9 1.75 C 8.783 1.75 8.604 1.821 8.463 1.962 C 8.321 2.104 8.25 2.283 8.25 2.5 C 8.25 2.717 8.321 2.896 8.463 3.037 C 8.604 3.179 8.783 3.25 9 3.25 C 9.217 3.25 9.396 3.179 9.537 3.037 Z" fill="rgb(28, 27, 31)" height="20px" id="I9jC3eofc" width="18px"/></g></svg>)
Field research was critical in uncovering constraints that would not be visible in desk research or assumptions.
" width="20px"><path d="M 3.75 15 C 3.417 14.6 3.138 14.171 2.913 13.712 C 2.688 13.254 2.5 12.775 2.35 12.275 C 2.267 12.008 2.3 11.771 2.45 11.562 C 2.6 11.354 2.817 11.225 3.1 11.175 C 3.383 11.125 3.638 11.175 3.863 11.325 C 4.088 11.475 4.242 11.683 4.325 11.95 C 4.408 12.217 4.513 12.471 4.638 12.712 C 4.763 12.954 4.908 13.192 5.075 13.425 C 5.242 13.658 5.417 13.871 5.6 14.062 C 5.783 14.254 5.983 14.442 6.2 14.625 C 6.417 14.808 6.554 15.033 6.613 15.3 C 6.671 15.567 6.633 15.817 6.5 16.05 C 6.367 16.283 6.167 16.438 5.9 16.512 C 5.633 16.587 5.392 16.542 5.175 16.375 C 4.908 16.175 4.654 15.958 4.413 15.725 C 4.171 15.492 3.95 15.25 3.75 15 Z M 10.5 20 C 10.083 20 9.729 19.854 9.438 19.563 C 9.146 19.271 9 18.917 9 18.5 L 9 12.5 C 9 12.083 9.146 11.729 9.438 11.438 C 9.729 11.146 10.083 11 10.5 11 L 12.7 11 C 12.95 11 13.188 11.058 13.412 11.175 C 13.637 11.292 13.817 11.458 13.95 11.675 L 14.5 12.5 L 18.5 12.5 C 18.917 12.5 19.271 12.646 19.563 12.938 C 19.854 13.229 20 13.583 20 14 L 20 18.5 C 20 18.917 19.854 19.271 19.563 19.563 C 19.271 19.854 18.917 20 18.5 20 Z M 1.5 9 C 1.083 9 0.729 8.854 0.438 8.563 C 0.146 8.271 0 7.917 0 7.5 L 0 1.5 C 0 1.083 0.146 0.729 0.438 0.438 C 0.729 0.146 1.083 0 1.5 0 L 3.7 0 C 3.95 0 4.188 0.058 4.412 0.175 C 4.638 0.292 4.817 0.458 4.95 0.675 L 5.5 1.5 L 9.5 1.5 C 9.917 1.5 10.271 1.646 10.563 1.938 C 10.854 2.229 11 2.583 11 3 L 11 7.5 C 11 7.917 10.854 8.271 10.563 8.563 C 10.271 8.854 9.917 9 9.5 9 Z M 15.2 7 C 15.017 6.683 14.808 6.392 14.575 6.125 C 14.342 5.858 14.083 5.608 13.8 5.375 C 13.583 5.192 13.446 4.967 13.388 4.7 C 13.329 4.433 13.367 4.183 13.5 3.95 C 13.633 3.717 13.833 3.562 14.1 3.487 C 14.367 3.412 14.608 3.458 14.825 3.625 C 15.175 3.892 15.5 4.183 15.8 4.5 C 16.1 4.817 16.375 5.158 16.625 5.525 C 16.975 6.042 17.263 6.596 17.488 7.187 C 17.713 7.779 17.867 8.392 17.95 9.025 C 17.983 9.292 17.904 9.521 17.713 9.712 C 17.521 9.904 17.283 10 17 10 C 16.717 10 16.479 9.908 16.288 9.725 C 16.096 9.542 15.975 9.308 15.925 9.025 C 15.858 8.658 15.767 8.308 15.65 7.975 C 15.533 7.642 15.383 7.317 15.2 7 Z M 11 18 L 18 18 L 18 14.5 L 13.425 14.5 L 12.425 13 L 11 13 Z M 2 7 L 9 7 L 9 3.5 L 4.425 3.5 L 3.425 2 L 2 2 Z" fill="rgb(28, 27, 31)" height="20px" id="j8JSqGVd8" width="20px"/></g></svg>)
Flexibility in the system (drivers, orders, delivery instructions) was more valuable than strict structure.
In emerging markets, logistics UX is heavily shaped by human coordination rather than purely digital workflows.
